General Email Marketing Statistics
- Global Email Users: By 2023, there were around 4.37 billion email users worldwide, expected to grow to 4.89 billion by 2027 (Statista, 2024).
- Daily Emails Sent: Globally, approximately 347 billion emails are sent each day (Radicati Group, 2023).
- Email Engagement Time: The average email user spends 2.5 hours a day checking personal and work emails (McKinsey, 2022).
Open Rates and Click Rates
- Average Email Open Rate: The average open rate across industries is approximately 21.89% (Brevo, 2024).
- Average Click-Through Rate (CTR): The average click-through rate for email marketing is about 3.96% (Brevo, 2024).
- Differences in Open and Click Rates Across Regions

- Mobile vs. Desktop Open Rates: 81% of emails are now opened on mobile instead of desktop (Upland, 2024).
- Impact of Mobile Experience om Engagement: 52% of customers are less likely to engage because of poor mobile experience (Upland, 2024).
Industry-Specific Statistics
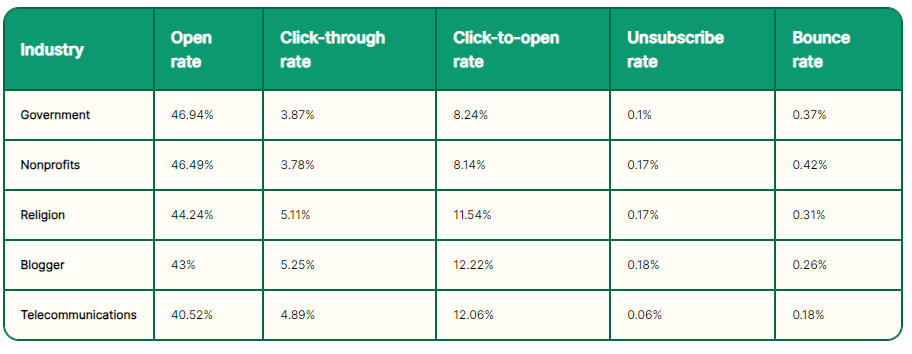
- Top Performing Industries: Government (46.94%), Nonprofits (46.49%) and Religion (44.24%) have the highest average open rates (Brevo, 2024).

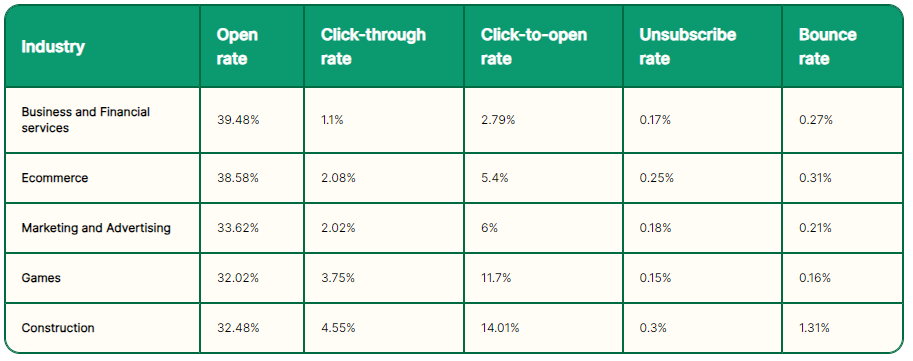
- Worst Performing Industries: Business and Financial Services (39.48%), Ecommerce (38.58%) and Marketing and Advertising (33.62%) have the lowest open rates (Brevo, 2024).

Impact on Sales and ROI
- ROI of Email Marketing: Email marketing delivers an average return on investment (ROI) of $36 for every $1 spent (Litmus, 2022).
- Highest ROI Channel: Email continues to be the highest-performing marketing channel in terms of ROI, even surpassing other digital channels (Litmus, 2022).
Personalization and Automation
- Personalization and Impact: 65% of marketers across the globe say that email is the most effective use of personalization when compared to website, live chat, SMS, social media, landing pages and mobile apps (Emarketer, 2023).
- Personalization Usage: 52% of marketers say they plan on including personalization in their email program beyond just the recipients’ names (Emarketer, 2023).
- Automated Email Sequences: 30% of global email revenue comes from automated campaigns, such as welcome or abandoned cart emails (Forrester, 2022).
- Consumer Expectations on Personalization: 72% of consumers say they expect the businesses they buy from to recognize them as individuals and know their interests (McKinsey, 2021)
Conversion Rates
- Email Conversion Rates: The average email marketing conversion rate across industries is around 15.22% (Statista, 2022).
- Abandoned Cart Emails: Abandoned cart emails have a conversion rate of 2.39% on average (Statista, 2024).
Send Day of the Week
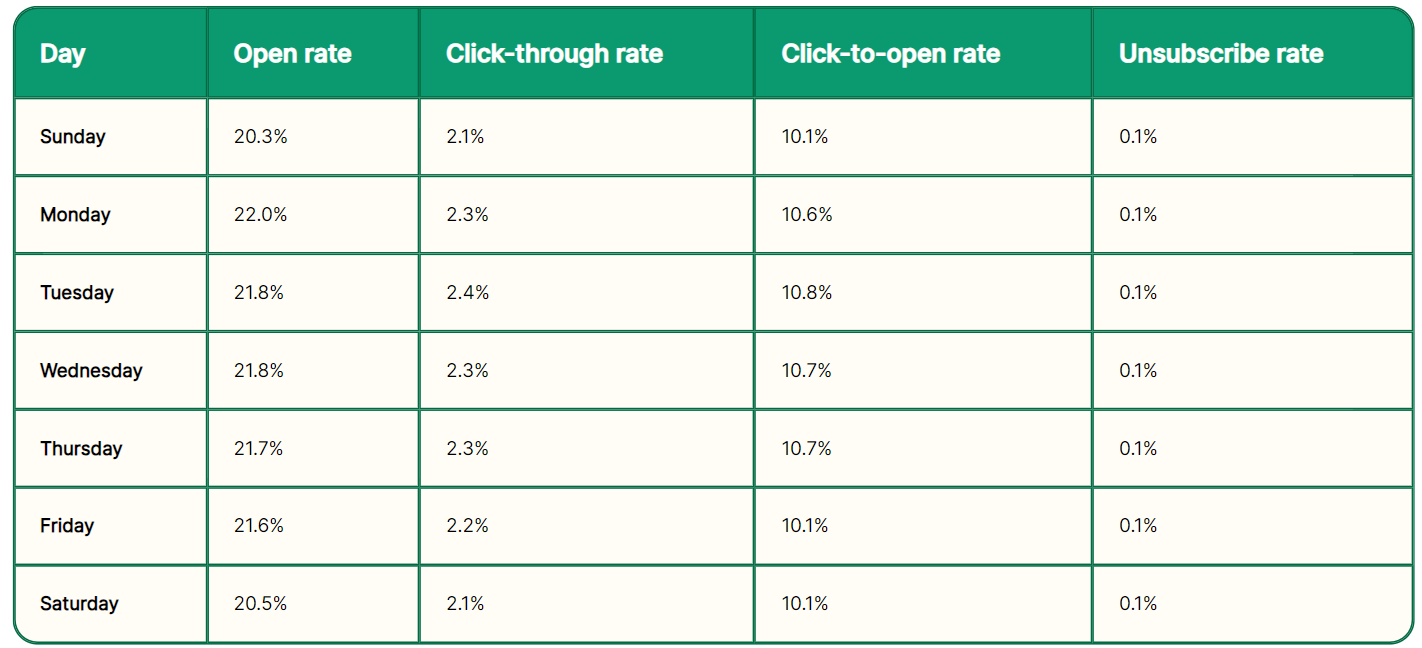
- Best Days to Send Email Campaigns: Monday and Tuesday have the highest open and click-through rates (Brevo, 2024).
- Worst Days to Send Email Campaigns: Saturday and Sunday have the lowest open and click-through rates (Brevo, 2024).
- Email Performance Metrics by Day of the Week (Brevo, 2024)

Demographics and Preferences
- Age Group Engagement: 80% of millennials prefer email for brand communication, while 74% of baby boomers are more likely to use email than social media for updates (McKinsey, 2022).
- Email Frequency Preferences: 61% of consumers prefer receiving promotional emails weekly, and only 15% prefer daily emails (Statista, 2023).
GDPR and Data Privacy
- GDPR Impact on Marketing: 51% of marketers have reported a decrease in email marketing performance since the introduction of GDPR (Data & Marketing Association UK, 2022).
- Data Privacy Preferences: 67% of consumers are more likely to open emails from brands that they have explicitly opted into and trust to protect their data (Pew Research Center, 2023).
These statistics demonstrate that email marketing remains a highly effective channel for businesses across various industries, with significant potential for engagement and ROI when leveraging personalization and strategic timing.
